Jun 02, 2016
The Dashboard, Campaign’s Measure(s) of Success, Gets Upgraded
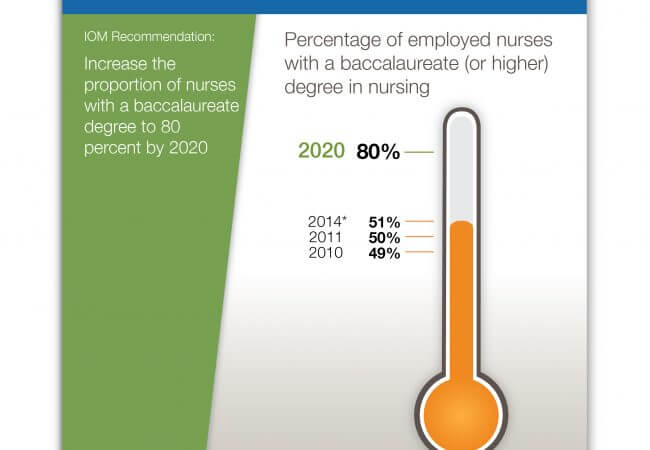
 Since the Institute of Medicine (IOM) set the Future of Nursing: Campaign for Action on its course with its recommendations in 2010, the Campaign and its Action Coalitions have used a dashboard to keep track of progress. That gauge has just been updated, in an effort to better measure, and reach, IOM goals laid out in the Future of Nursing: Leading Change, Advancing Health and updated in 2015.
Here’s a primer on how to read the dashboard, and a few examples of the upgrades:
In pursuit of implementing the IOM recommendations, the Campaign concentrates on certain areas, or pillars, and their related goals. For each pillar, there’s a dashboard indicator.
One of the most significant additions made in this round of dashboard updates has to do with a goal that has long been integral to all the pillars: diversity. Now, in addition being tracked within some of the pillars, diversity also has its own indicator to measure efforts at increasing the diversity of the nursing workforce. This reflects the IOM’s urging in 2015 that the Campaign focus on diversity even more.
Workforce data, also a key part of all the pillars, now will be measured using different criteria: supply, demand, and the educational capacity to meet projections.
Other changes dashboard aficionados might notice:
- Indicator 2 is now the total number of employed nurses with a doctoral degree; before, this was a subcategory of education.
- Indicator 3 is the Campaign’s map of the country showing the level of regulation in each state. This replaces the map used before, produced by the American Association of Nurse Practitioners.
- Indicator 5, which is new, shows the number of nurses who report serving on boards to the Nurses on Boards Coalition. Previously, the dashboard showed the percentage of nurses serving on hospital boards.
Find the dashboard indicators for each pillar and goal on the issues page, or get an overall look on the Campaign dashboard itself.
